A User's Guide to Running the CMS-HCC Risk Adjustment Model Using the Python Package Index
Medicare Advantage plans use the CMS-HCC risk adjustment model to secure accurate CMS payments, identify enrollees with potential HCC discrepancies, and pinpoint high-risk members for targeted disease management. Traditionally, operating CMS's software necessitates a SAS® license. However, MScore® by riskadjustmentmodel.com offers a streamlined, user-friendly alternative that supports multiple operating systems and programming languages. This article introduces MScore® and provides a practical guide for using the software via Python Package Management (PyPI).
Value Proposition of MScore®
MScore® offers an alternative solution for calculating CMS-HCC risk scores, removing the need for organizations to code and update the risk model with each new version release. It leverages cloud and open-source technologies and is compatible with both Windows and Linux operating systems, highlighting its versatility. MScore® can be utilized as a Command-line interface (CLI), through Python Package Management (PyPI), or via Application Programming Interface (API) integration, making it adaptable to diverse operational needs.
Highlighted Features of MScore®:
Up-to-Date: Supporting CMS-HCC models from 2021-2024, including V28, MScore® stays up-to-date with the latest CMS release.
Cross-Platform Compatibility: MScore® offers an easy-to-use solution that's not limited to a single programming language, OS, or computing environment.
Flexibility: MScore® caters to diverse technical needs and preferences whether you prefer using a Command-line interface (CLI), Python package index (PyPI), or an Application programming interface (API).
Rich Support: A variety of resources, tutorials, and integration support options ensures you can maximize the utility of MScore®.
Running MScore® using Python
To showcase MScore®'s practical application, we'll guide you through a Python workflow on a Windows operating system that includes: 1) Creating a workspace with a virtual environment and the necessary Python packages, 2) Writing the Python script in an Integrated Development Environment (IDE), and 3) Executing the code and visualizing the results using Jupyter Notebook extension. For these code snippets, you'll need the following Python dependencies:
For optimal use of this guide, download our synthesized Person and Diagnosis data files to your project folder to follow along with the same datasets. Obtain a license key here.
The Python version used in this guide is 3.10.11.
Step 1: Creating our work space
Below, we will be using Visual Studio Code (VSCode) with Windows PowerShell to create and install our package dependencies.
- Installing virtual environment
- Downloading our Python dependencies and activation
- On your desktop, create a folder and name it appropriately for your project. Then, open the folder in VSCode
your_project_name
- Open PowerShell in VSCode and run command: python -m venv mscore_env to create your virtual environment
PS C:\Users\User\Desktop\your_project_name> python -m venv mscore_env
- Use this PowerShell command to activate the virtual environment. You will know it is activated when the path is prefixed with parentheses with command: .\mscore_env\Scripts\Activate
PS C:\Users\User\Desktop\your_project_name> .\mscore_env\Scripts\Activate
- Install the dependencies with command: pip install mscore pandas plotly plotly-express
(mscore_env) PS C:\Users\User\Desktop\your_project_name> pip install mscore plotly plotly-express
- After you've installed MScore®, run the following command to activate your free 90-day trial. An internet connection is required to activate & run the package: mscore -a <license key>
(mscore_env) PS C:\Users\User\Desktop\your_project_name> mscore -a <license key>
Step 2: Building our Python Script
We will write the script in the Jupyter Notebook extension on VSCode, dividing the code into two sections to explain its functionality.
- Implementing MScore®
- v24_2024_scores.risk_scores
- v24_2024_scores.relative_factors
- Visualize your data
- Initialize the MScore® model using imported modules and datasets, reads person and diagnosis data from CSV files, and calculates risk scores based on the CMS-HCC model for the year 2024. The results are then stored in DataFrames for further analysis.
import sourcedefender # This package is required at the top
from mscore import AuthorizeLicense, MScore
import pandas as pd
from pathlib import Path
import plotly.express as px
import plotly.io as pio
from IPython.display import display
# Read person and diagnosis data from CSV files into pandas DataFrames
person_df = pd.read_csv('person.csv')
diag_df = pd.read_csv('diag.csv')
# Define the staging key for authorization
staging_key = "<your_license_key>"
# Validate the authorization using the staging key
auth = AuthorizeLicense(staging_key).validate()
# The MScore class requires 7 arguments in order to run with 2 optional arguments.
model = MScore(
authorizer=auth,
year='2024',
version='V24',
model='CMS-HCC',
person_data=person_df,
diag_data=diag_df,
columns='all-fields',
rf_output=True,
)
# Calculate the risk scores using the MScore model
v24_2024_scores = model.score_mscore()
# Create DataFrames from the risk scores and relative factors
scores = pd.DataFrame(v24_2024_scores.risk_scores)
relative_factors = pd.DataFrame(v24_2024_scores.relative_factors)
The resulting 'v24_2024_scores' output is a data model object of pandas.DataFrames. You can access your risk scores or relative factors data sets by calling the respective model name from the grouped data model.
From here, you can proceed to use the risk score or relative factor DataFrames for further downstream processing or utilize the Pandas built-in methods to save to a file type of your choosing.
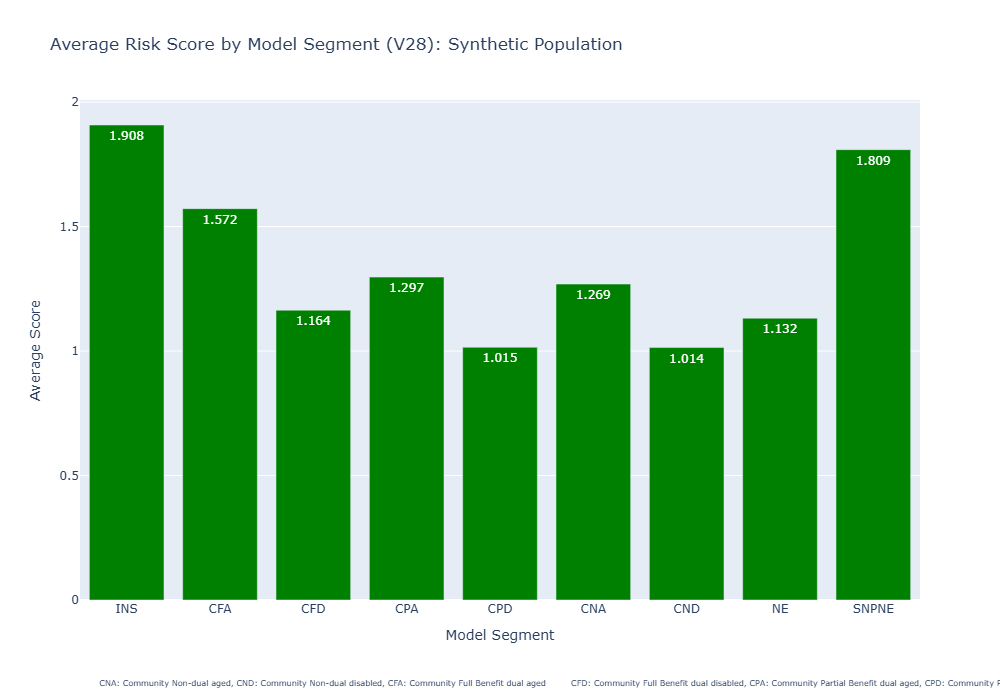
- Generate a bar graph visualizing average risk scores by model segment using Plotly Express, updates the plot's trace properties and layout, adds an annotation, and then displays the plot in a Jupyter Notebook.
# Create a DataFrame for plotting, containing the average scores for each model segment
df = pd.DataFrame(
[{i.split('_')[0]: round(scores[i].mean(), 3) for i in scores.columns if '_SCORE' in i}]
)
# Create a bar plot using Plotly Express
fig = px.bar(
df.values,
x=df.columns.tolist(),
y=df.values[0],
color_discrete_sequence=['green'],
title="Average Risk Score by Model Segment (V28): Synthetic Population",
labels={
"y": "Average Score",
"x": "Model Segment"
},
text_auto=True
)
# Update the plot's trace properties
fig.update_traces(textfont_size=12, textangle=0, textposition="inside")
# Update the plot's layout
fig.update_layout(
autosize=False,
width=1000,
height=700,
margin={'b': 100}
)
# Add an annotation to the plot
fig.add_annotation(
showarrow=False,
text="""
CNA: Community Non-dual aged, CND: Community Non-dual disabled, CFA: Community Full Benefit dual aged
CFD: Community Full Benefit dual disabled, CPA: Community Partial Benefit dual aged, CPD: Community Partial Benefit dual disabled
INS: Institutional, NE: New enrollee, SNPNE: C-SNP New enrollee
""",
align="left",
font=dict(size=8),
xref='x domain',
x=-0.01,
yref='paper',
y=-.18
)
# Set the default renderer to 'notebook' for Jupyter Notebooks
pio.renderers.default = "notebook"
# Display the plot
display(fig)
Step 3: Visualizing Average Risk Scores with Plotly
Finally, for executing and visualizing the results, we use Plotly Express to create a bar chart, allowing us to examine specific descriptive statistics from our dataset. In this case, we focus on the average score by model segment. While MScore® uses abbreviations for these segments, our chart includes annotations with their full names for easy reference (see the list below):
- INS: Institutional
- CFA: Community Full Benefit dual aged
- CFD: Community Full Benefit dual disabled
- CPA: Community Partial Benefit dual aged
- CPD: Community Partial Benefit dual disabled
- CNA: Community Non-dual aged
- CND: Community Non-dual disabled
- NE: New enrollee
- SNPNE: C-SNP New enrollee
This straightforward three-step Python process enables you to run the MScore® CMS-HCC model efficiently, handle the output adeptly, and use visualization tools for insightful analysis. MScore®, known for its Python compatibility, offers significant benefits to data-driven healthcare organizations by streamlining data operations with a modern approach.
As the volume and complexity of healthcare data continue to escalate, tools like MScore® become indispensable in simplifying essential operations and reducing costs. With the combination of MScore® and Python, your organization is well-equipped to adeptly manage CMS-HCC risk adjustments, ensuring precise CMS payments for the care provided to Medicare enrollees.
Disclaimer: The code examples above are for illustrative purposes and may require proper environment setup, license keys, or additional parameters to work effectively in your specific context. Always refer to MScore® documentation or reach out to support@riskadjustmentmodel.com if you have questions.